HOW ADAPTIVE RESILIENCE INTELLIGENCE WORKS

From fragmented evidence to verified improvement.

Technology and security tools can tell you a great deal about your environment. The harder challenge is turning that information into decisions, action and measurable improvement. Adaptive Resilience Intelligence creates a structured journey from what your organization knows to what it does next.
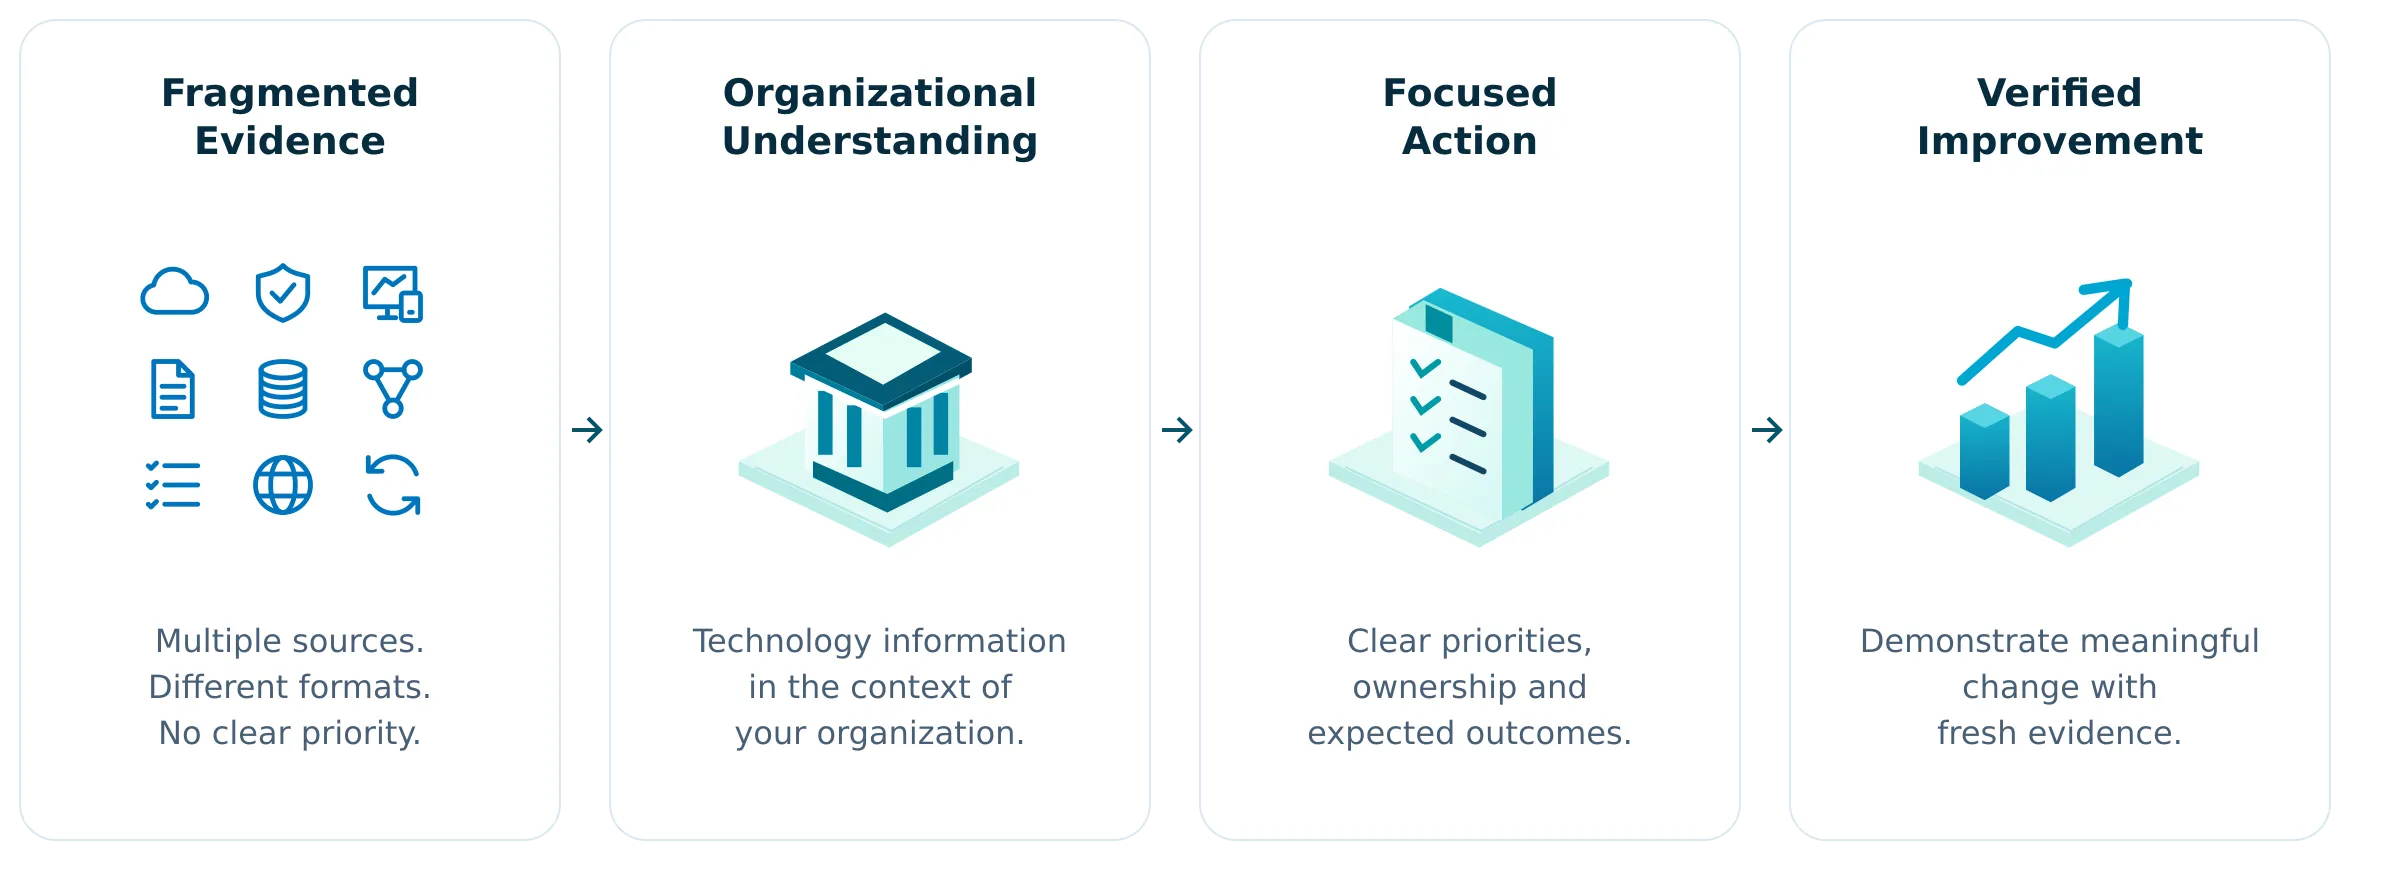
Four-step infographic showing progression from fragmented evidence to verified improvement: first, icons of cloud, shield, documents, database, network, globe with note 'Multiple sources. Different formats. No clear priority.'; second, building icon with text 'Technology information in the context of your organization.'; third, checklist icon with text 'Clear priorities, ownership and expected outcomes.'; fourth, bar chart with upward arrow and text 'Demonstrate meaningful change with fresh evidence.'
THE GAP BETWEEN INFORMATION AND IMPROVEMENT

Seeing a problem is not the same as knowing what to do about it.

Organizations already receive security findings, technology recommendations, audit observations, identity information, endpoint data, assessments and operational information.

But information alone does not answer the questions that matter most to leaders and technology teams.

Blue question mark inside a blue circle.
Does this matter to us?
Blue gear or cogwheel icon with eight teeth and a circular hole in the center.
What deserves attention first?
Blue icon of two user profiles side by side, representing multiple users or a group.
What action should we take?
Blue icon of two user profiles side by side, representing multiple users or a group.
Who owns it?
Blue ascending bar chart with three vertical bars increasing in height from left to right and a line graph with an arrow pointing upward representing growth or progress.
Did anything actually improve?
Information
Blue shield outline with a checkmark inside representing security or protection.
Security findings
Blue gear or cogwheel icon with eight teeth and a circular hole in the center.
Recommendations
Blue document icon with a folded top-right corner and three horizontal lines representing text.
Assessments
Blue icon of two user profiles side by side, representing multiple users or a group.
Signals
Blue database icon showing a stack of cylindrical disks representing data storage.
Observations
Three blue check marks each followed by a horizontal blue line, representing a checklist or completed tasks.
Operational data
Clearer decisions
Blue check mark inside a blue circle.
Organizational understanding
Blue check mark inside a blue circle.
Focused priorities
Blue check mark inside a blue circle.
Accountable action
Blue check mark inside a blue circle.
Evidence of progress
Blue check mark inside a blue circle.
Continuous improvement

Connect. Understand. Prioritize. Act. Verify. Improve.

A continuous journey that turns technology and cybersecurity evidence into measurable resilience improvement.

Blue database icon showing a stack of cylindrical disks representing data storage.
01
Connect
Start with trusted evidence.
A stronger starting point.
Blue icon of a light bulb with a circular outline and filament inside.
Understand
Put technology information into organizational context.
02
Clearer understanding.
Blue ascending bar chart with three vertical bars increasing in height from left to right and a line graph with an arrow pointing upward representing growth or progress.
Prioritize
Focus limited capacity where it matters most.
03
More deliberate focus.
Blue gear or cogwheel icon with eight teeth and a circular hole in the center.
Act
Turn priorities into accountable improvement.
04
Clearer ownership and progress.
Blue check mark symbol.
Verify
Determine whether the action actually worked.
05
Evidence-backed progress.
Two blue curved arrows forming a circle, one pointing left and up, the other pointing right and down, symbolizing refresh or reload.
Improve
Build a continuously improving picture of resilience.
06
Ongoing improvement across the organization.
DESIGNED AROUND DECISIONS, NOT DATA VOLUME

Start with what needs attention. Inspect the evidence when you need it.

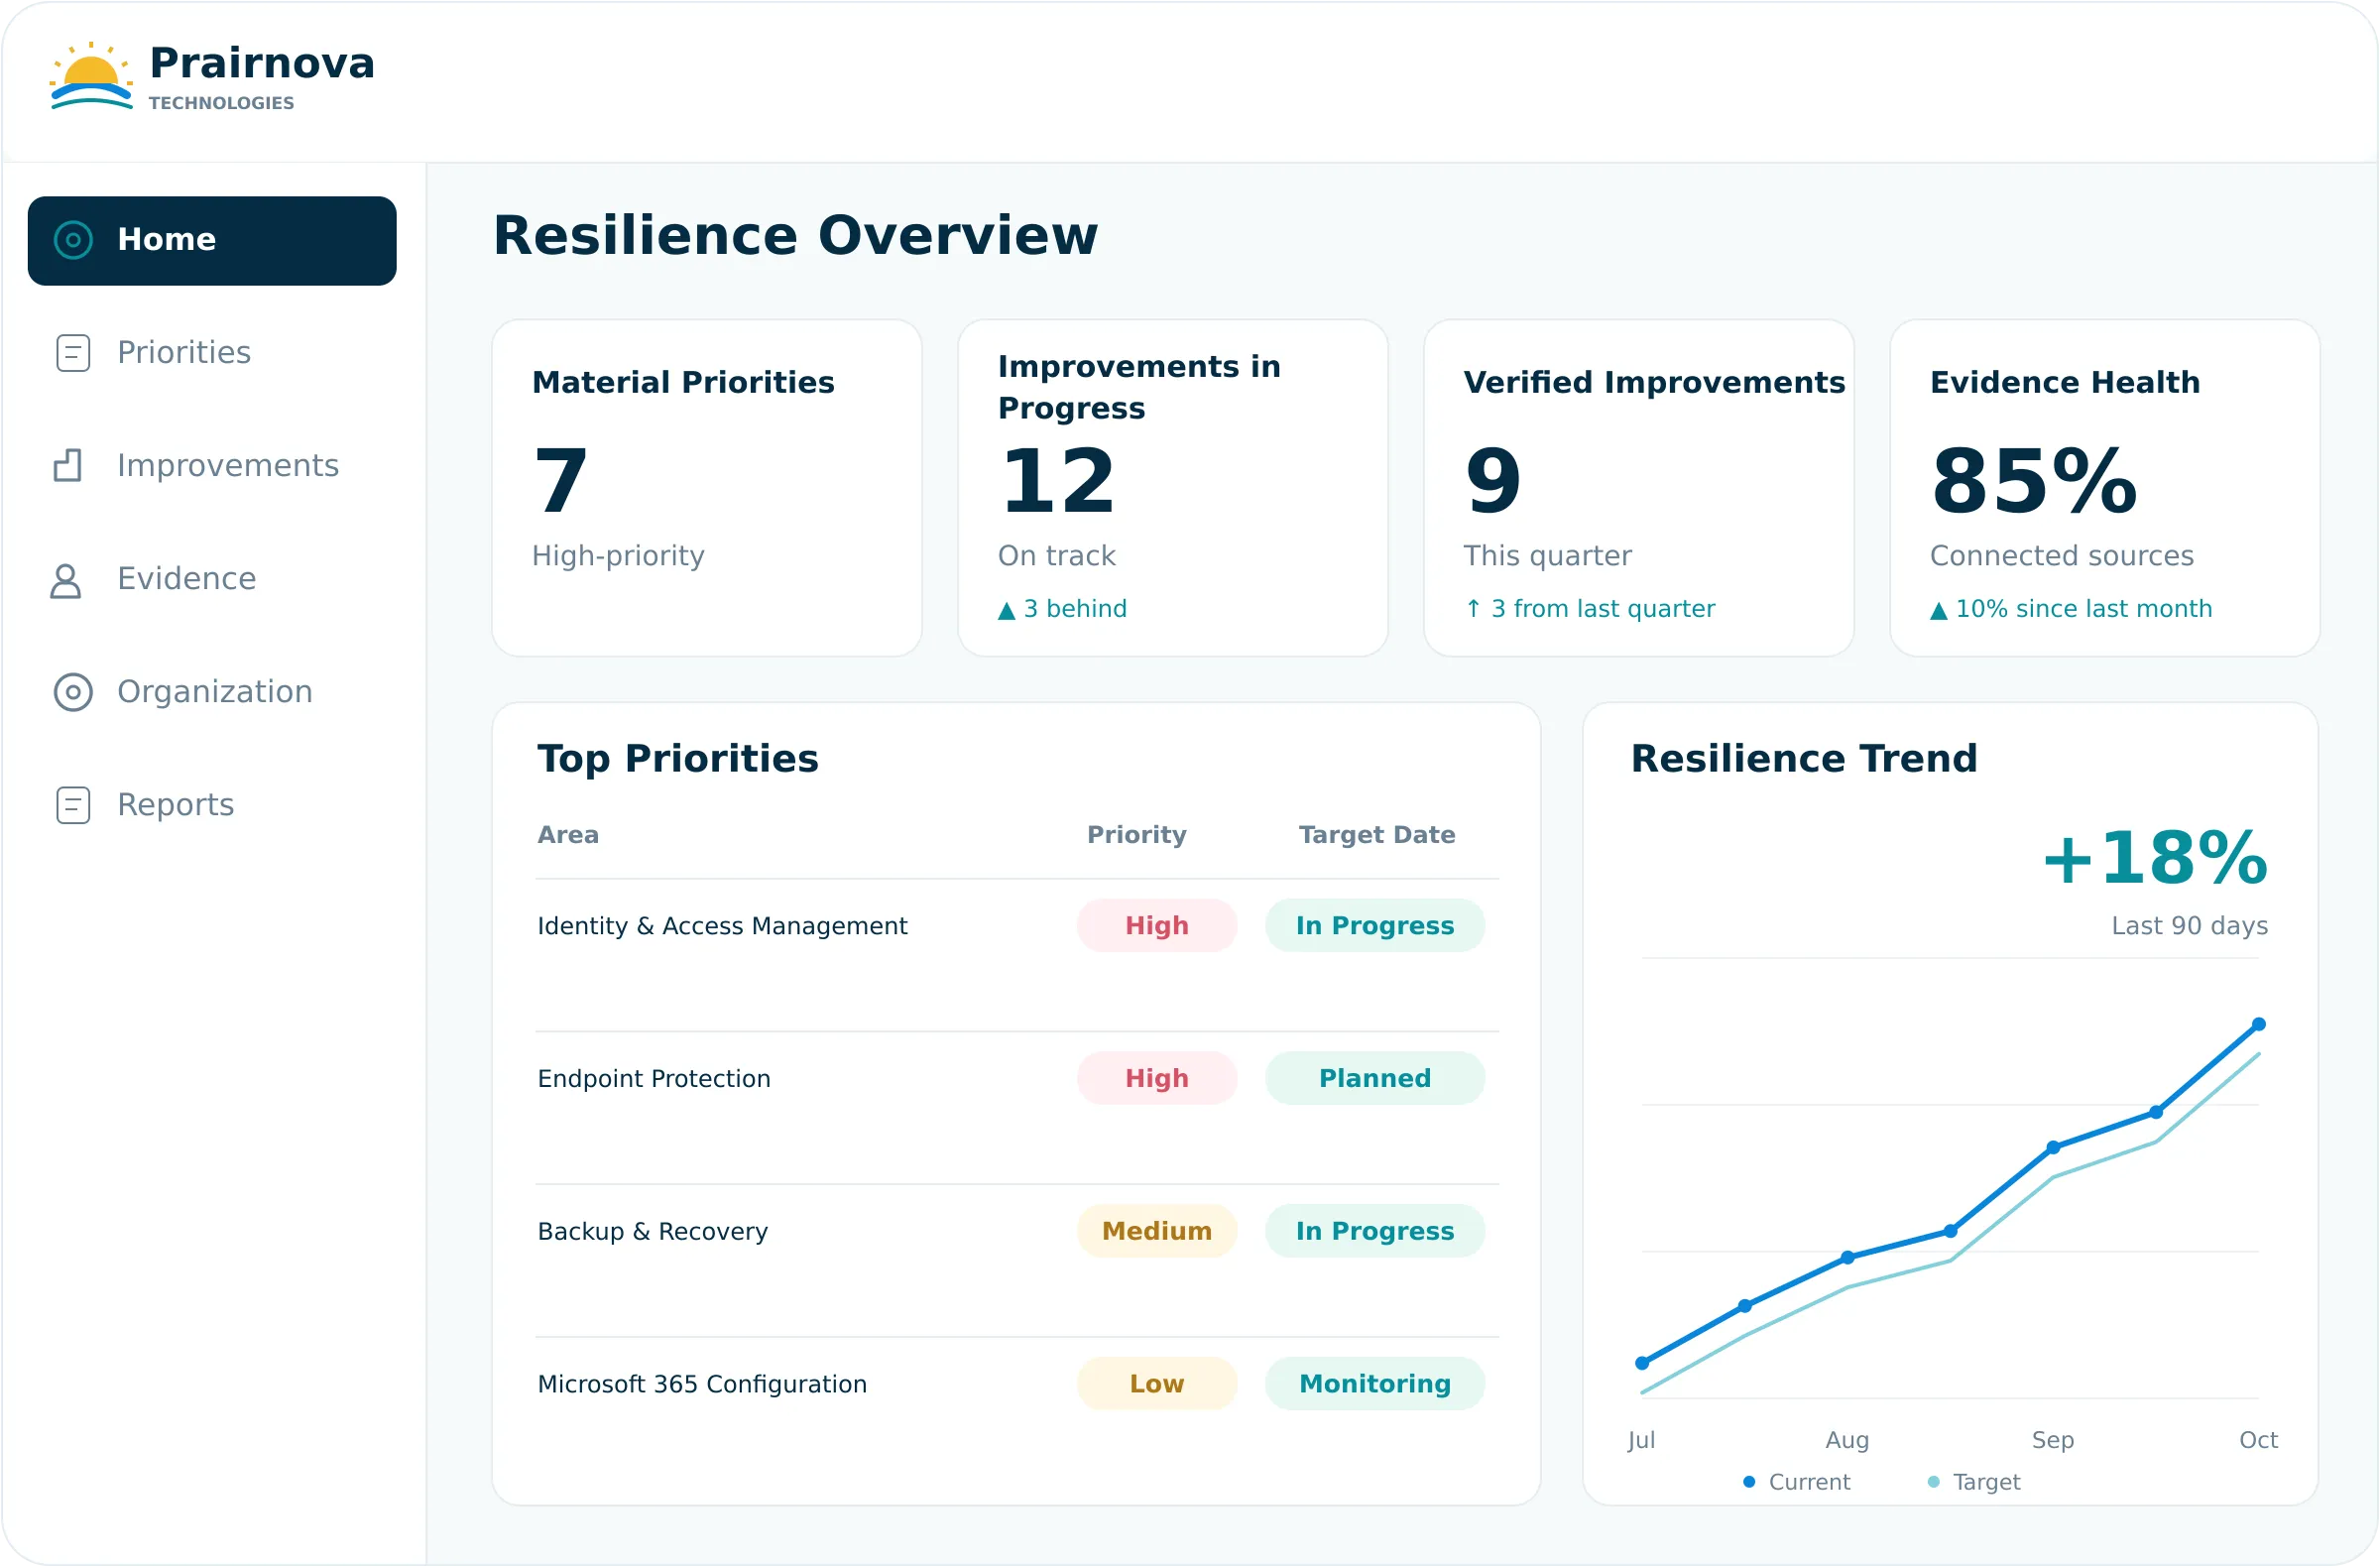
ARI is designed so that leaders can begin with the decision while technology teams can move deeper into the supporting evidence. The experience uses progressive detail rather than forcing every user into the same technical dashboard.

Dashboard of Prairnova Technologies showing resilience overview with material priorities as 7 high-priority, 12 improvements in progress with 3 behind, 9 verified improvements this quarter with 3 more than last quarter, and 85% evidence health with 10% increase since last month. Top priorities include Identity & Access Management and Endpoint Protection as high priority with statuses In Progress and Planned, Backup & Recovery medium priority In Progress, and Microsoft 365 Configuration low priority Monitoring. A line graph shows resilience trend rising 18% over the last 90 days from July to October.
THE THINKING BEHIND THE EXPERIENCE

Designed for better decisions, with people still accountable.

Blue document icon with a folded top-right corner and three horizontal lines representing text.
Evidence-connected
Important conclusions remain connected to supporting information.
Blue icon of two user profiles side by side, representing multiple users or a group.
Human-accountable
Material decisions remain with authorized people.
Blue shield outline with a checkmark inside representing security or protection.
Controlled
AI operates within defined purposes, permissions and customer boundaries.
Blue target icon with an arrow hitting the center circle.
Outcome-focused
The objective is measurable improvement, not task volume.
Explore Security & Trust

See how ARI can help your organization focus on what matters.

We’re working with selected organizations to validate Adaptive Resilience Intelligence in real operating environments.

White check mark inside a white circle.
Early access to ARI capabilities
White check mark inside a white circle.
Initial resilience view
White check mark inside a white circle.
Prioritised improvement opportunities
White check mark inside a white circle.
Direct engagement with the product team